 |
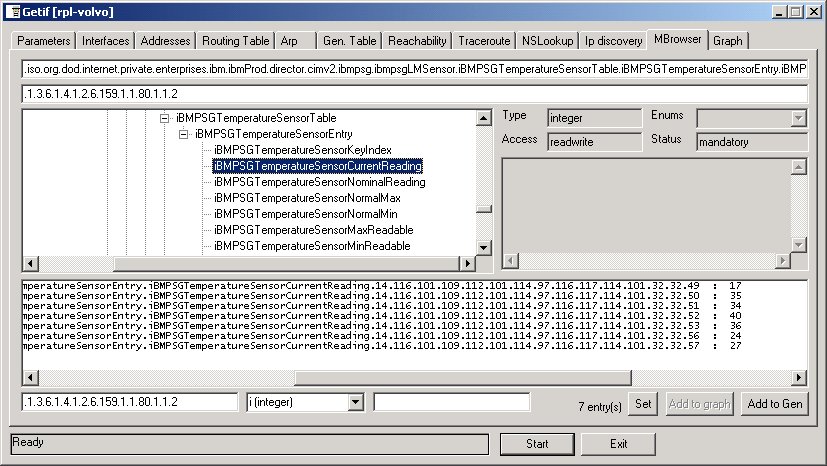
SNMP (Simple Network Management Protocol
In this section I enabled SNMP on all devices in my network. I then used a program called getif to get information from all the devices on our network. I then researched other programs that can do the same thing as getif or even better. A similar program to getif is FreeSnmp. I found it really easy to use if not easier.
|
Click on Image
|
|
Click on Image
Click on Image
|
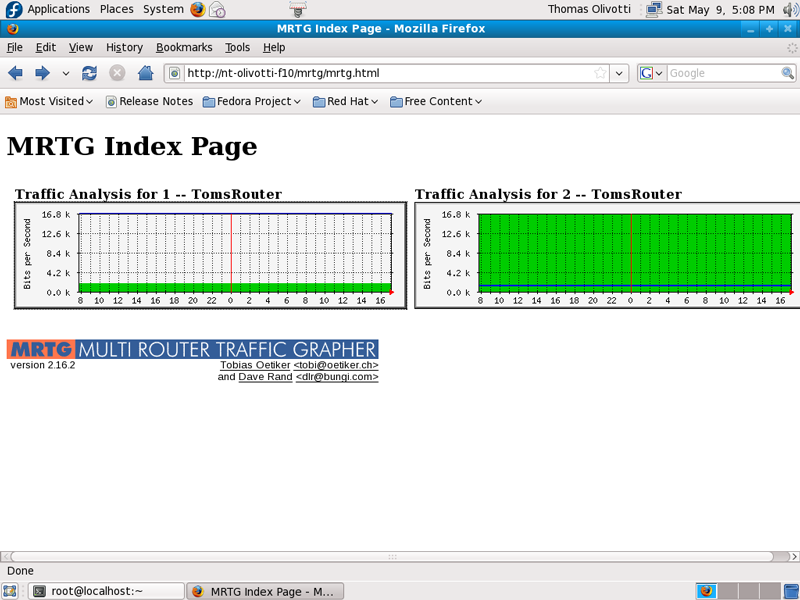
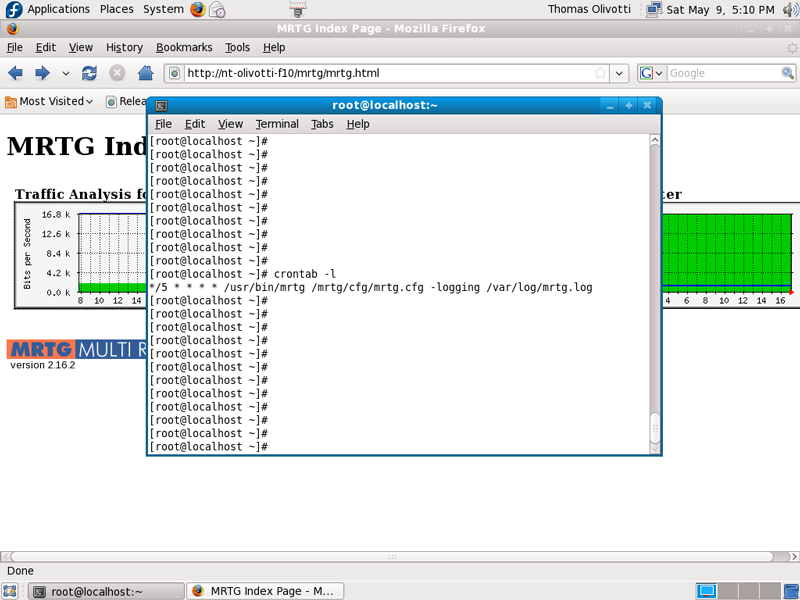
MRTG
In this section I installed MRTG on my Linux Server. With MRTG I am able to monitor my Cisco Router. I used the command cfgmaker to make my MRTG configuration file. Once my config file was made I then needed to make a cron job to update my graphs with the new information.
|
|
Click on Image
Click on Image
Click on Image
Click on Image
Click on Image
Click on Image
Click on Image
Click on Image

|
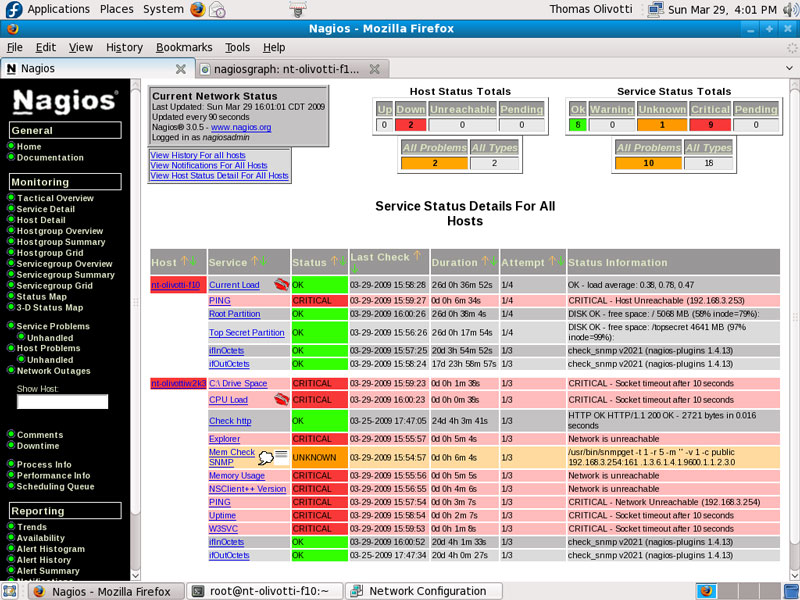
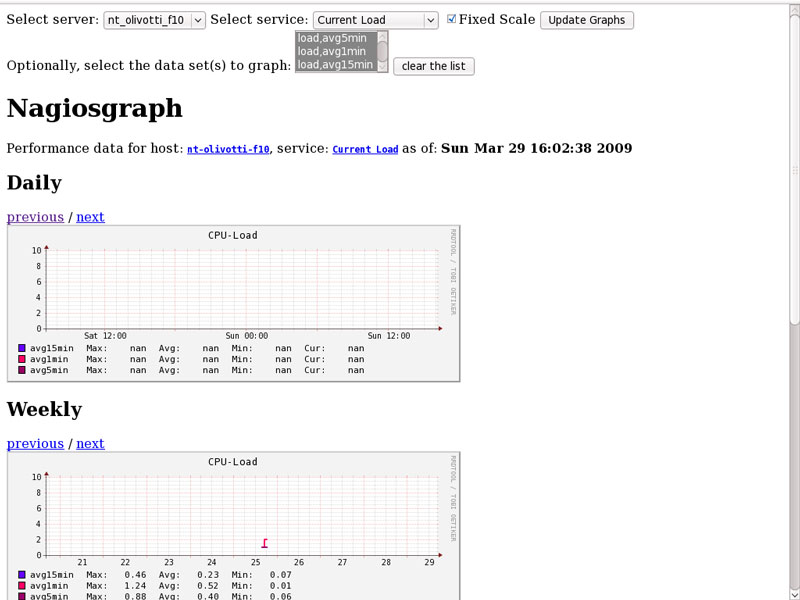
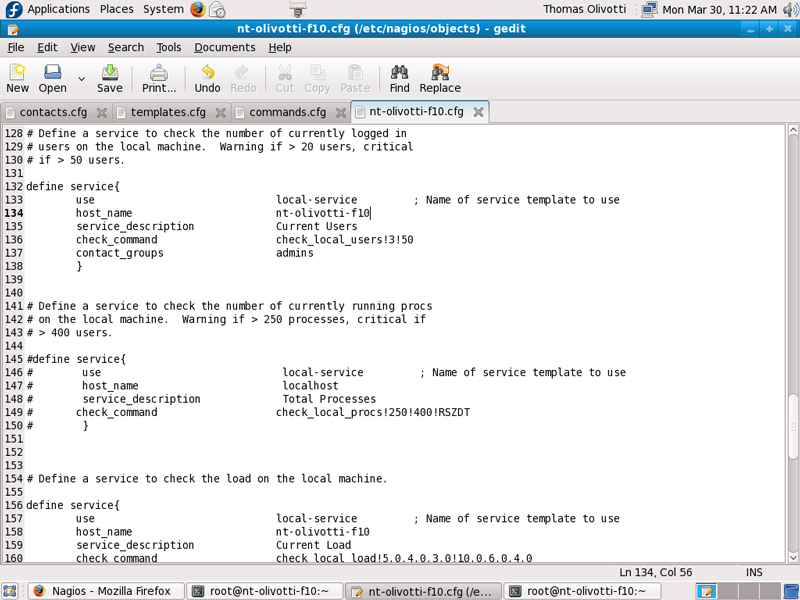
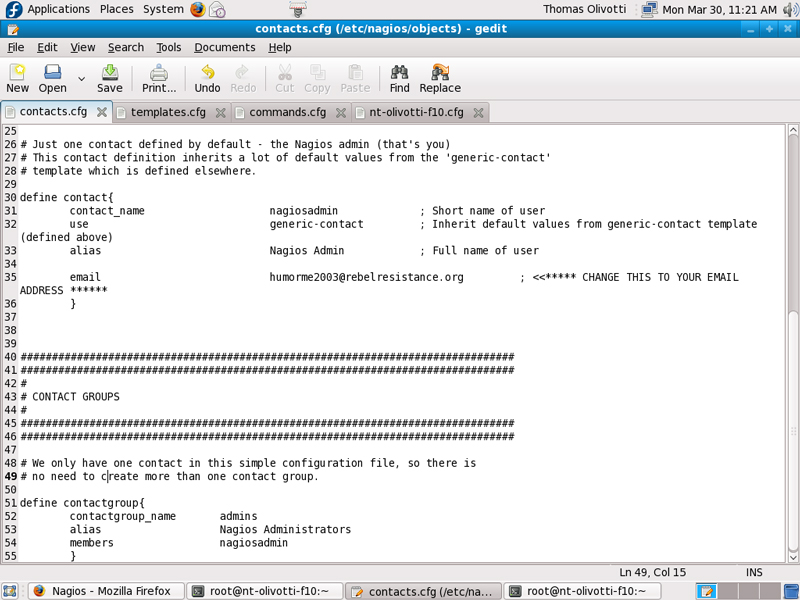
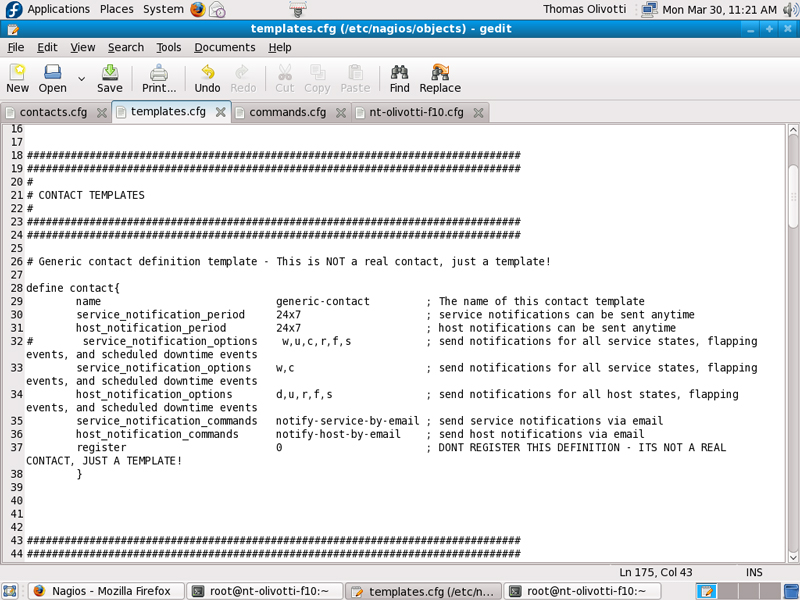
Nagios and Nagios Graph
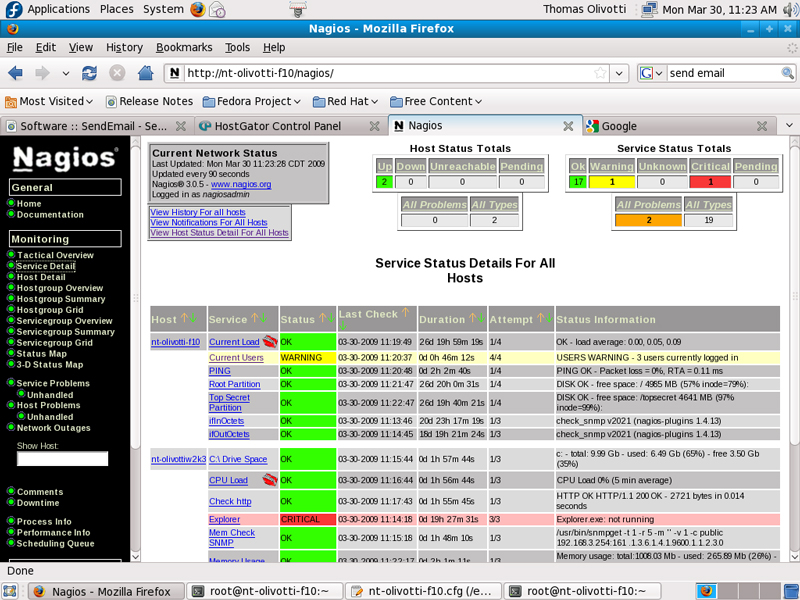
In this section I installed Nagios on my Linux server to monitor everything in my network.
I then uncommented the appropriate service and command configuration entries for Nagios to begin monitoring my network.
After my NSClient++ client was installed on my windows machines I could begin monitoring the LAN.
Once I was able to pull in accurate information I needed to graph it to determine baselines.
I installed nagiosgraph on my Linux Server and began graphing the output. Granted that my output is very low because it is a virtual environment and not running round the clock.
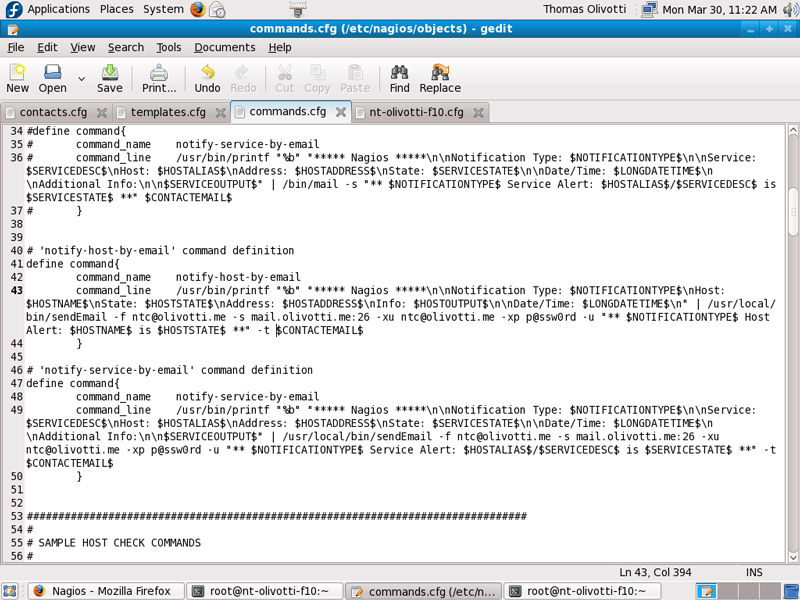
Next I configured Nagios to send me emails on warnings and critical alerts.
|
|
Click on Image
Click on Image
|
Network Monitoring System
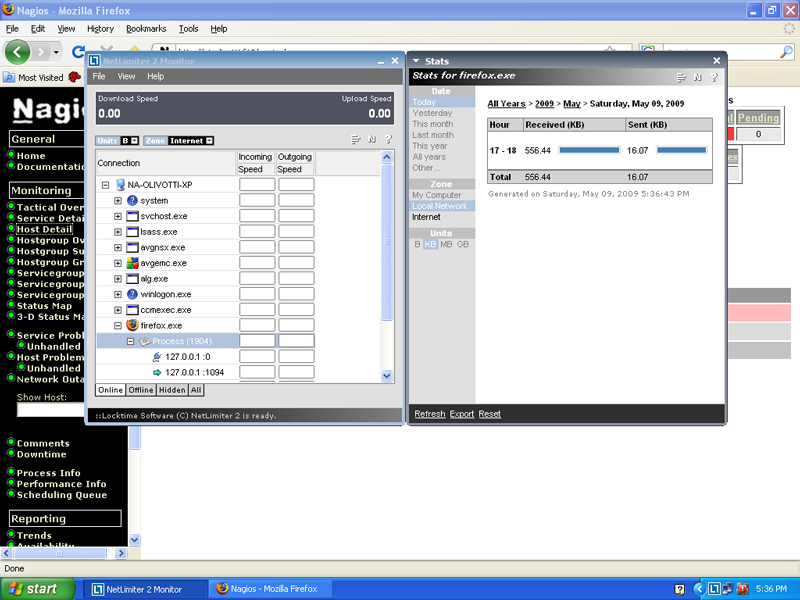
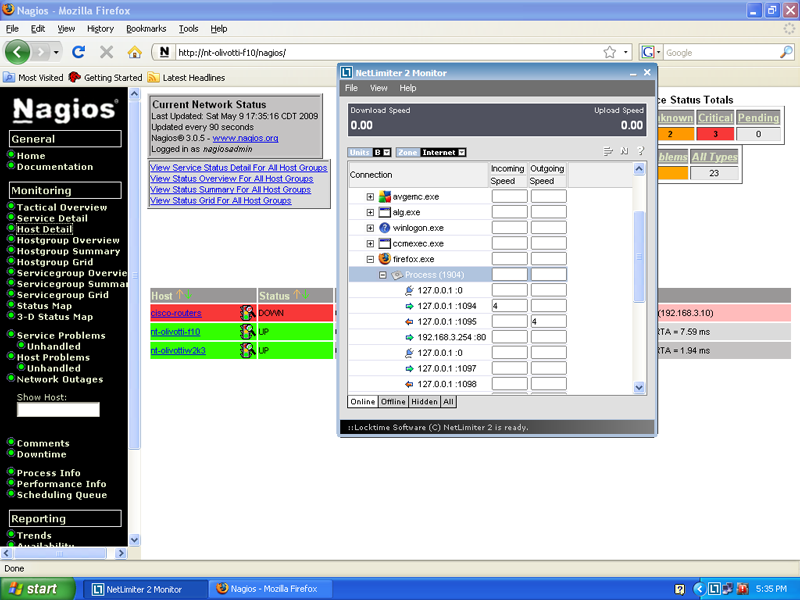
In this exercise I researched and found a different Network Monitoring System. The NMS I found and installed was Netlimiter 2 Monitor.
|
|


)
)
)
)
)
)
)
)
)
)
)
)
)